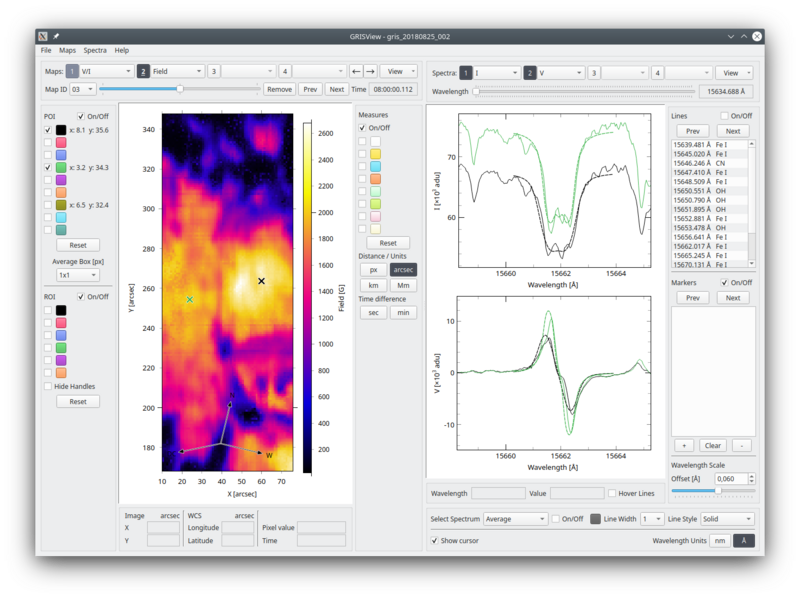
The recently released version 0.7 now supports GRIS/IFU datasets, inversion results import and adds new viewing options. This version is intended to be used more widely outside the SDC and is designed to allow user feedback, fix bugs, and gather suggestions for future development.
A non-exhaustive list of features includes:
Data formats:
- Load GRIS@GREGOR datasets as distributed through the SDC web archive
- Work with single map and time-series observations
- Support the IFU mode datasets, including time-series
- Import inversion maps and best-fit Stokes profiles
Viewing features:
- Advanced view, pan and zoom functions for map and spectral plots
- Multiple POI (Point-of-Interest) and ROI (Region-of-Interest) for easy inspection of spectral profiles across the map
- Interactive map colorbars with histograms for image contrast and color scheme customization
- Contours generation for maps with manual level adjustment and colour selection
- Display input and derived parameters, e.g. Q/I, V/I, DOLP (degree of linear polarisation) etc.
- Show the FTS atlas intensity spectrum for comparison
- Spectral line identification and quick navigation
- Compass to indicate map orientation and direction to the disc center
Analysis tools:
- Distance measurements between map points in different units
- Profile cuts along multiple map directions, linking centers for checking radial profiles
- Relative wavelength scale for quick measurements
- User-defined wavelength markers
- Quiet Sun regions selection and interactive continuum fitting
Other features:
- View FITS file headers of observations
- Export current map and spectral panels as images
- Sessions to save and restore program configuration
- In-program user manual with GUI description and screenshots
Installing and feedback
Instructions for installing and using the program can be found on the tool's GitLab page: https://gitlab.leibniz-kis.de/sdc/gris/grisview
Please report any issues, bugs and feature requests on the program GitLab page or use the direct link: https://gitlab.leibniz-kis.de/sdc/gris/grisview/-/issues/new?issue