Solar Physics and Stellar Connections
At the institute for Solar Physics we conduct fundamental research on the magnetic field of the Sun with a focus on the interpretation of observations of polarized light emitted by the Sun at different wavelengths (near UV, optical, near-IR and radio) with the aim of investigating the thermal, kinematic and magnetic connectivity through the solar atmosphere (photosphere, chromosphere and corona). Observational studies are aided by magneto-hydrodynamic simulations of the solar plasma in order to test our inference capabilities and gain a deeper insight into the physical processes occurring on the solar atmosphere. With these tools we try to improve our understanding and predictive capabilities of explosive and energetic events (flares, eruptions, coronal mass ejections, etc.) that can have very negative impacts on Earth's upper atmosphere, as well as understanding basic processes such as sunspot formation and decay or the dynamo in the Sun and Sun-like stars. Below you will find two examples of our work, one using observations and another using numerical simulations.
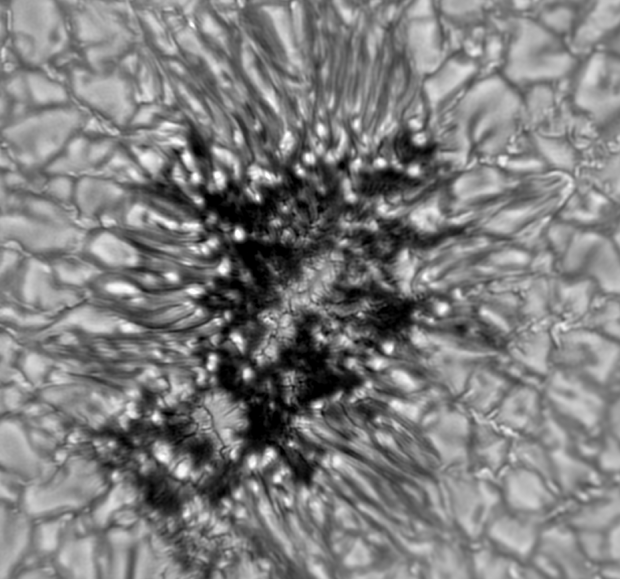
Space- and time- variation of magnetic fields in a solar plage photosphere
The maps show the vertical (colormap) and horizontal (lines) magnetic field in a solar plage, at two depths in the solar atmosphere: log(τ)=1 (base of the photosphere), and log(τ)=-2 (upper photosphere). Small-scale opposite polarities are visible in the deeper layers. The structure of the magnetic field is inferred from the integral field unit observations obtained with the MiHI instrument mounted at the Swedish Solar Telescope. Dept-stratified inversion code with mageto-hydrostatic constrains, FIRTEZ, was used to infer the structure of the field from the spectropolarimetric observations. For more details, see Liu et al 2025.
Interaction of Magnetic Fields with a Vortex Tube at Solar Subgranular Scale
The grayscale panel shows the synthesized continuum intensity. The contours in green outline the linear polarisation calculated from the synthesized Stokes profiles. The circular polarization is marked by red and blue contours. The 3D scene above displays the temperature and the flow field below the Rosseland optical depth log(τ) = 0 (black curve). The magnetic field lines that cross the section plane are shown in pink color. The circular close-up view provides a clear look at the temperature, flow field, and magnetic field orientation at the location of the granular lane. (Figure from Fischer et al., the visualization was done with ParaView)

